

Abstract
Cool pavements represent one of several strategies that can mitigate the effects of urban overheating by increasing albedo. By definition, this means increasing reflected and potentially re-absorbed short-wave radiation but also decreased surface and air temperatures and longwave upwelling, thus reducing radiant temperatures. So far, real-world studies have been inconclusive as to net effects from cool pavements. A project by GAF installed reflective pavements in Pacoima, California, in summer of 2022. This study set out to perform detailed, high spatiotemporal resolution, multi-platform observations to quantify micrometeorological benefits of the cool pavements and address concerns regarding glare, chemistry/air quality, and pedestrian thermal comfort. Results indicated large variability, as expected, but that the dominant effects were beneficial both in direct side-by-side, real-time comparisons (RT) between test and reference areas, as well as in difference-of-difference (DofD) to quantify local changes in test areas. During a heatwave in September 2022, maximum air-temperature differences (averaged over individual street segments) reached up to −1.9 °C RT in the afternoon. During non-heatwave, hot summer days, the largest street-segment-averaged afternoon air-temperature differences reached up to −1.4 °C RT or −2.8 °C DofD, and surface temperature up to −9.2 °C RT or −12.2 °C DofD. Whereas above values represent maximum effects, more typical street-segment averages also showed statistically significant benefits. In the afternoon, the mean of air-temperature differences was −0.2 °C RT and −1.2 °C DofD. The mean of surface-temperature differences was −2.6 °C RT and −4.9 °C DofD. Indicators of pedestrian thermal comfort also showed variability but predominantly a cooling effect. The mean of differences in mean radiant temperature was between −0.9 and −1.3 °C RT, and for physiological equivalent temperature, between −0.2 °C and −0.6 °C RT and −1.7 °C DofD. In terms of predicted mean vote, the mean of differences was −0.09 RT and −0.32 DofD.
Export citation and abstract BibTeX RIS

Original content from this work may be used under the terms of the Creative Commons Attribution 4.0 licence. Any further distribution of this work must maintain attribution to the author(s) and the title of the work, journal citation and DOI.
Introduction
Over the past several years, GAF and Climate Resolve worked extensively with Pacoima Beautiful to establish outreach to the local community and install cool pavements in their neighborhoods in June/July of 2022. Pacoima, California, is located in some of the hottest parts of the San Fernando Valley in Los Angeles.
Reflective pavements are increasingly being considered as one potential measure from a portfolio of urban-cooling strategies that aim at reducing overheating in cities. In this context, the effects of cool pavements can be viewed and evaluated at two scales: (1) the community or city scales and (2) street and individual/pedestrian levels. There have been a number of studies, both numerical and observational, that evaluated the effects of cool pavements at these two levels with mixed results—they are numerous and, thus, only a few are referenced here.
At the community and larger scales, there is generally an agreement on the cooling benefits of cool pavements, e.g., Santamouris (2014), Taha (2008a), Akbari et al (2012), Kyriakodis and Santamouris (2017), Akbari and Matthews (2012), Ko et al (2022), Taha (2021), and Gilbert et al (2017), but with different magnitudes depending on locale, weather, extents of coating, and levels of modification. Recent research (Wang et al 2019, 2022) has also examined the benefits of pervious pavements not only in terms of storm-water management but also in mitigating urban heat via enhanced water-absorption and evaporative cooling.
However, it is at the pedestrian or individual scales that divergence exists in opinions on the effects of reflective pavements. For example some studies suggest negative glare and radiant-temperature effects (Taleghani et al 2016), UV-albedo increase (Epstein et al 2017), or radiant-temperature increase (Middel et al 2020, Engel et al 2023, Schneider et al 2023).
It is, of course, well understood that cool pavements increase the amount of reflected solar radiation -- after all, that's the purpose of deploying reflective surfaces, but also decrease surface temperature, air temperature, and the upwelling of longwave radiation. And while the micrometeorological effects of cool pavements might be more straightforward to quantify at the community scale, the net effects are more complex to assess at pedestrian level because of the interactions among several mechanisms and their impacts on the human body. The effects can be positive or negative depending on a host of factors, including the properties of the environment and the reflective products used.
This study set out to revisit and reevaluate the interactions among environmental variables, demonstrate the potential effects and benefits of cool pavements at community and street scales, and, at the pedestrian scale, evaluate the effects of co-varying temperatures and heat fluxes that can offset or compensate for the effects of increased reflected shortwave radiation. This was based on high spatiotemporal resolution, multi-platform observations in Pacoima, California, over a period of a year to evaluate the benefits from installing GAF's DuraShield-SR and address some of the concerns typically associated with cool pavements, such as glare, impacts on photochemistry, and pedestrian-level thermal comfort.
Method
Site
Prior to the start of this study, a community in Pacoima, California was selected by Climate Resolve and GAF for installation of reflective pavements. When the research component was subsequently initiated, two adjacent and similar sections of the community were selected as test and reference areas to compare, side-by-side, the surface and near-surface micrometeorology before and after coating with reflective pavements (figures 1 and 2).

Figure 1. Top left: coated streets and surfaces (yellow) in the project area (looking north); Top right: coated parking lot in project area; Bottom: a coated-street section compared to uncoated asphalt and a concrete sidewalk. Images courtesy of GAF.
Download figure:
Standard image High-resolution image
Figure 2. Test (blue) and reference (red) areas in Pacoima. Black line shows direction of a single loop of mobile-transect observations, starting and ending at a school site (S). Yellow circles are the project's weather stations. The white diagonal line is Borden Street, separating the test and reference areas.
Download figure:
Standard image High-resolution imageThe total area of the test community (blue polygon in figure 2) is 259,560 m2 of which a total area of 59,570 m2 (yellow highlight in figure 1) was coated with GAF's reflective materials, which represents 23% of the test community's area. While this appears to be smaller than reported in other studies, e.g., Schenieder et al (2023), the modifications are concentrated in a smaller area (so the modified surfaces exert a larger effect than if more spread out). The area of the adjacent reference community (red polygon in figure 2) is 250,530 m2.
The test and reference areas have similar weather and flow patterns; they also have similar tree cover, continuity in and orientation of streets, sky-view factors, building heights and setbacks, urban morphology, and pavement types. Additional information on buildings, streets, the percentages of impervious surfaces and vegetation cover in the project area are provided in table A-1 of the Supplement. Figure 3 shows a typical sky-view factor/aspect ratio of streets in the study area and 1-m resolution tree cover. Buildings do not cast shadows on the streets and, conversely, increased road albedo does not reflect much radiation onto walls or other building surfaces. For the purpose of mobile observations, the segments of each street were defined as E (test) or W (reference) per their position (east or west) relative to Borden Street running at the junction between the test and reference communities (figure 2).
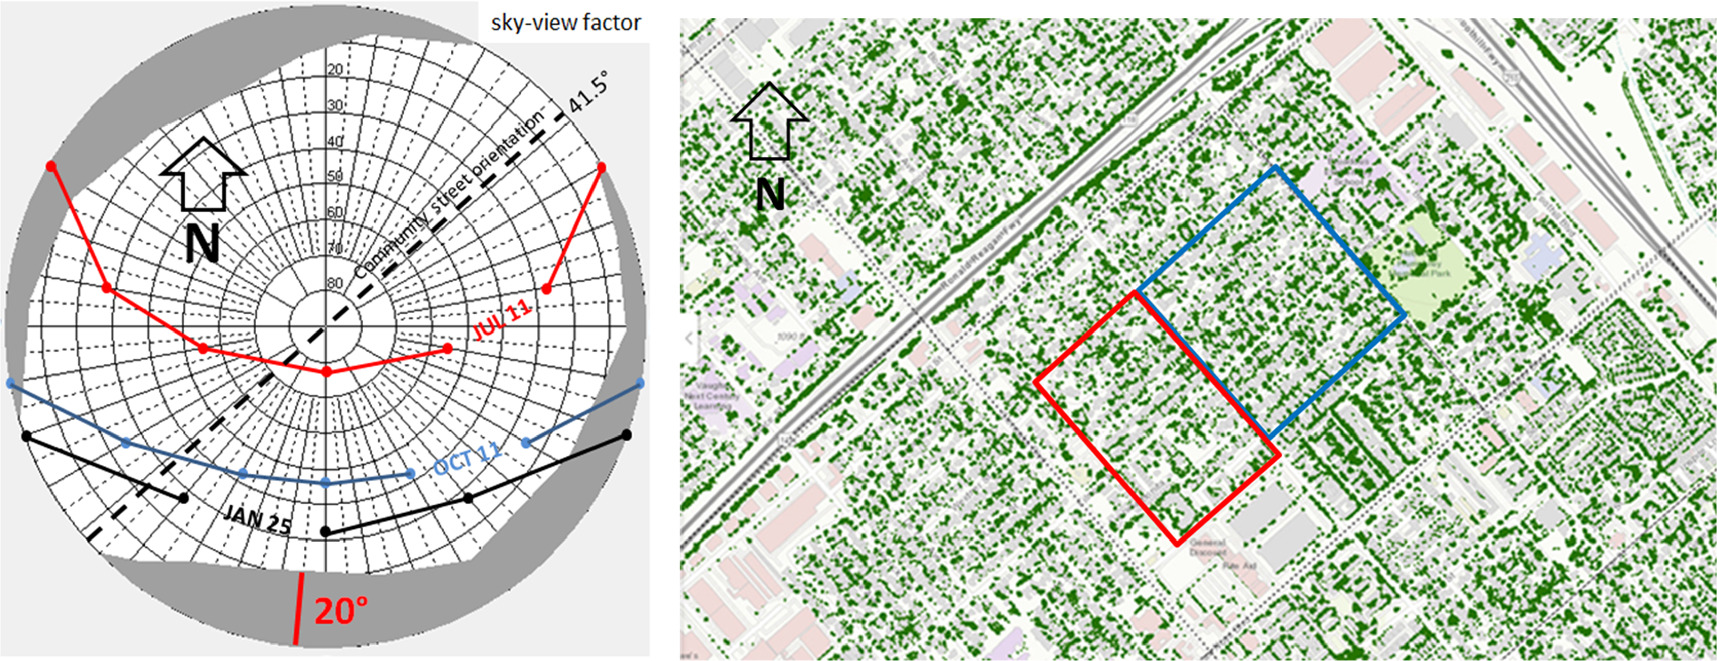
Figure 3. Typical street aspect ratio and sky-view factor in the study area (left) showing the orientation of streets, obstructions, and sun tracks. Right: 1-m tree cover in the test area (blue rectangle) and the reference area (red rectangle) highlighting the similar cover in the project area (also see table A-1 in the Supplement). The tree cover was derived using USFS/EarthDefine/USGS data (data discussed in McPherson et al 2017).
Download figure:
Standard image High-resolution imageDetailed morphological characterizations were carried out to demonstrate similarity between the test and reference areas (pre-coating) and ensure that observed side-by-side micrometeorological differences following reflective-coatings installation were caused by albedo modifications and not by physical or morphological differences. Furthermore, a difference-of-difference approach (discussed below) was also designed to cancel out any possible remnant effects, even if small or negligible, caused by such potential variations.
Observational platforms and sensors
A multi-scale, multi-platform approach was designed to observe and characterize the effects of cool pavements on the surface and near-surface thermal environment and physical properties. From top of atmosphere down to surface, the platforms were:
- Satellites: MODIS for 500-m albedo, Landsat-9 for 30-m albedo, ECOSTRESS for 70-m land-surface temperature, and Sentinel-2 for 10-m albedo (citations in References section). Broad-band albedo was computed from narrow-band reflectance using suitable weighting functions (e.g., Liang et al 1999).
- Aircraft: NASA/JPL HyTES (Hulley et al 2016): data were obtained for several flyovers in the project area—they provide snapshot thermal imagery and temperature data (figure 4).
- Drone: GAF operated a drone over Pacoima, before, during, and after coating of various surfaces in the project area. The drones provided both visible and thermal imagery.
- Automated weather stations: Two weather stations (type ATMOS 41, METER Group) were installed in test and reference areas on City of LA street lighting poles (figure 5). The purpose was to capture above-canopy background conditions over the test and reference areas and ensure that any thermal environmental changes within the urban canopy were not caused by some changes in background conditions.
- Mobile platform: an electric golf cart was instrumented and used as the main observational platform in extensive mobile transects through the test and reference communities. An electric cart was selected to avoid the effects of tailpipe exhaust heat on temperature readings. A major advantage of the golf cart is that it is a fully-instrumented platform that can continuously cover the entire project area while at speeds lower than those of cars thus allowing a better capture of cool-pavements' effects.
- Reflectometer: Research-grade Solar-I (Surface Optics Corporation, SOC 2021) reflectometer was used for spot, in situ measurements prior to and after reflective coatings were installed (figure 5). Broad-band albedo was derived from various reflectance bands using weighting coefficients per Levinson et al (2010, 2017).
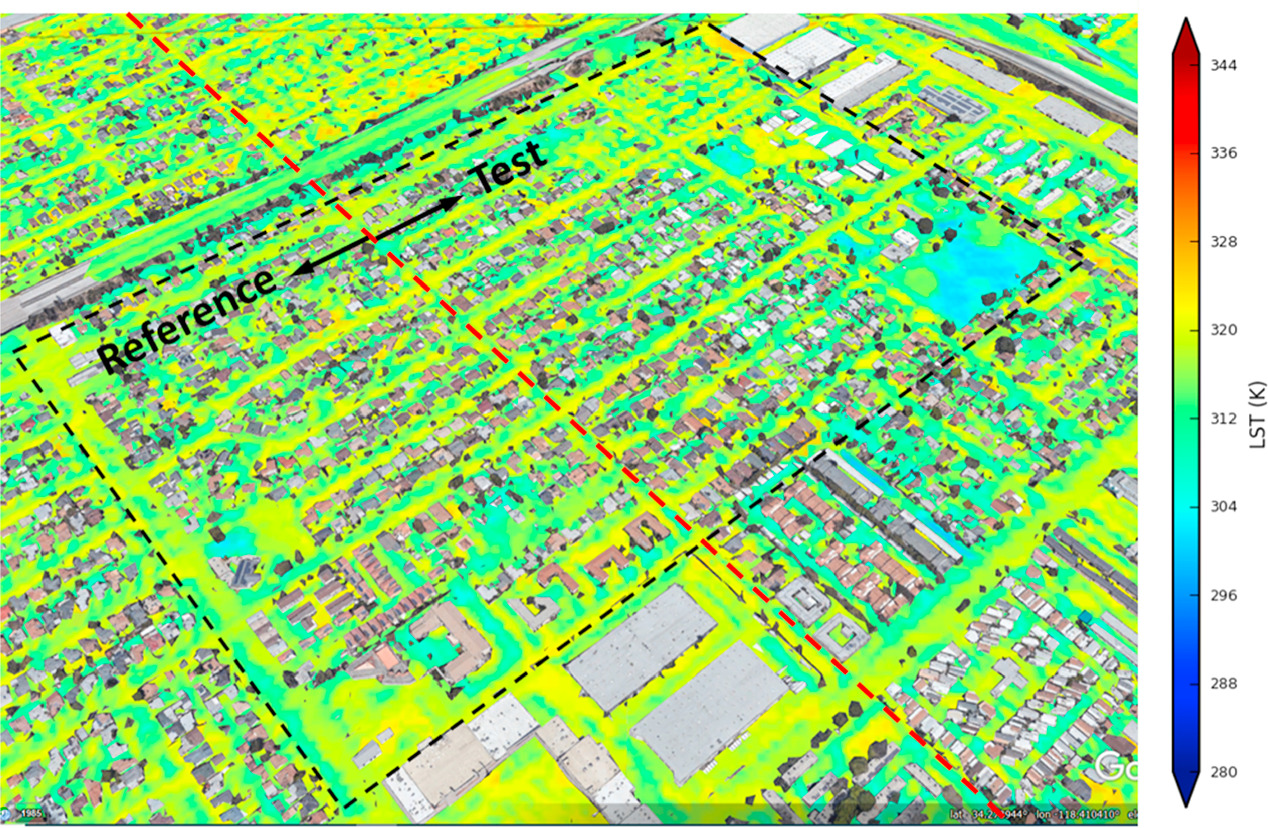
Figure 4. Land-surface temperature in the study area (black-dash rectangle) prior to coating. The test and reference communities are on opposite sides of the red dash line. Example for March 25th, 2022, 1630 PDT based on NASA JPL 2.5–5 m HyTES data.
Download figure:
Standard image High-resolution image
Figure 5. Left: One of two weather stations installed in the project area. Right: Solar-I reflectometer (right image source: surface optics corporation).
Download figure:
Standard image High-resolution imageMonitoring plan, micrometeorological variables and derivatives
Aside from the remote sensing and in situ spot measurements listed above, all observations in this study were made by (1) sensors on a mobile platform (electric golf cart) for surface, near surface, and in-canyon street-level observations, and (2) weather stations installed on light poles (one in test, the other in reference communities) for above canopy, background micrometeorological characterizations. The two weather stations operated continuously during the entirety of the project (and continue to do so) whereas the mobile transects were carried out during several days a month and several sorties a day, for a total of 73 full transects over a 1-year period (dates and associated weather conditions can be found in the Supplement figure A-1). Each transect was 6,755-m long (figure 2) and the cart was driven at between 2 and 4 m s−1 with continuous measurements to capture community-wide effects, not just at predetermined locations or street intersections.
The cart was instrumented with research/science-grade sensors (Campbell Scientific and Apogee Instruments), configured and mounted on a frame specifically designed in this study (figure 6). Two METER Group weather stations were installed on City of LA light poles to monitor above-canopy background conditions (figure 5). Variables from cart and stations were logged at 5–10 s intervals including multi-level air temperature, relative humidity, wind speed, wind direction, wind gusts, solar radiation, precipitation, barometric pressure, lightning count, lightning distance, multi-directional short- and long-wave radiation, incoming and outgoing short- and long-wave radiation, surface temperature, surface albedo (net radiometer), and position (GPS). The net radiometer (sensor #11 in figure 6) was mounted on an extendable telescopic arm to avoid the shadow and view-factor effects from the cart. A list of the sensors and their relevant specifications are provided in table A-2 of the Supplement.

Figure 6. Electric golf cart and sensors. Bottom images courtesy of GAF and Climate Resolve.
Download figure:
Standard image High-resolution imageComparisons of micrometeorological variables between the test and reference segments of each street (figure 2) were made in two manners. One is in real time (RT), i.e., direct side-by-side differences at the same time, and the other is a difference-of-difference (DofD) applied at each street segment, time of day, and similar weather conditions, so that, for a variable V:


For recurring similar environmental conditions at the reference community, i.e., when

DofD is:

which is the local change in V at the test area resulting from implementing cool pavements. Because DofD also accounts for baseline conditions, it is a more suitable indicator to the effects of cool pavements than RT alone. For micrometeorological variables, both RT and DofD are presented in this paper. For heat-wave conditions and some thermal-comfort metrics, only RT is presented as there were no pre-coating baseline conditions to compare with.
DofD is applied to the averages of readings at each street segment, not to the 10-s readings as it is not feasible to ensure that observations occured at the same exact point in different mobile transects. Further, based on the analysis of pre-coating micrometeorology, the following conditions are to be met when applying DofD but also evaluated on a case-by-case basis.
At street level:
- Clear-sky conditions throughout the day or mostly clear
- Solar radiation at solar noon > 600 W m−2
- Average 15 min wind speed < 4 m s−1
- Wind direction SSW—SSE
Background/above canopy:
| mid time interval | mean air temperature | wind speed |
|---|---|---|
| 0900 PDT/PST | ≥ 19 °C | ≤ 2.5 m s−1 |
| 1100 PDT/PST | ≥ 23 °C | ≤ 3.0 m s−1 |
| 1400 PDT/PST | ≥ 27 °C | ≤ 4.5 m s−1 |
| 1600 PDT/PST | ≥ 27 °C | ≤ 5.5 m s−1 |
Thermal environmental/thermal comfort metrics
In addition to the primary, directly-observed variables, several derivatives were computed depending on scale, i.e., community or street level. At the community scale, derivatives included wet-bulb globe temperature, NWS Heat Index, UHI Index, as well as various cumulatives relative to different thresholds. At the street level, and in addition to these derivatives, several thermal indicators were computed at 10-s intervals along every mobile transect for all sorties that were performed. These include MRT, PET, PMV, and PPD, as discussed next. Of those, only MRT was reported in some other studies of cool pavements.
Mean Radiant Temperature (MRT)
In prior studies, e.g., Middel et al (2020), Schneider et al (2023), and Engel et al (2023), MRT (or TMRT) was used or referenced in evaluating the effects of increased reflected shortwave radiation on thermal comfort. However, the implicit assumption that one degree of radiation is equivalent to one degree of convection applies only when the wind and pedestrian are at a complete standstill. A more realistic approach includes an accounting for radiative (hr ) and convective (h.c. ) heat-transfer coefficients (e.g., at the human body) when evaluating the effects of changes in MRT.
Per de Dear et al (1997), the whole-body convective heat-transfer coefficient (h.c. , W m−2 K−1) is:

where u is in m s−1. On the other hand hr is relatively constant at 4.5 W m−2 K−1 (for a whole-body standing configuration). Thus at 2–4 m s−1 (usual range of wind speed in the Pacoima area), h.c. /hr would range from 3.4 to 5.0; meaning a decrease of 1 °C in air temperature won't be canceled out until MRT increases by 3.4 to 5 °C, respectively. Or, if a subject is walking slowly at, say, 1 m s−1 with no wind, h.c. /hr would be ∼2.3 (meaning it will require 2.3 °C of MRT increase to cancel out the effect of 1 °C reduction in air temperature). Restated in yet another way, if MRT increases by, say, 3 °C and a pedestrian is moving or subject to a wind speed of 3 m s−1, then the sensation perceived by a pedestrian would be as if air temperature were increased by 0.7 °C.
In addition, MRT may not be the best-suited indicator for outdoor street level thermal comfort assessments as it does not account for physiological, activity, or clothing effects. A better use of MRT would be as one of several input variables to computing the physiological equivalent temperature (PET), as discussed below. Furthermore, while some studies accounted for the shape factor of the human body in calculating MRT, they did not account for the view factor in radiative exchange between a person and the pavements especially when the subject is at a sidewalk, for example, which is more realistic than assuming a person standing in the middle of a street.
In this study, the calculation of MRT is split into diffuse and direct components, similar to its use in the RayMan model of Matzarakis et al (2010), to allow evaluations under different conditions e.g., indirect or direct sun. Thus, for each 10-s interval of every mobile transect:

which is a slight simplification of equation (6), since the sensors measure the integrated effects of various flux components.


Here, L is upwelling longwave radiation, A shortwave absorptivity of the receiving body, F is the view factor to individual surface components, ε is emissivity of receiving body, ϕ is overall view factor to radiating surfaces, i.e., streets, buildings, vegetation, f is form factor (accounts for the angle between incident solar radiation and a standing or walking person, thus, a function of body posture and solar altitude angle, θ, at the time of observation), and Ks is incoming solar radiation (from the sky). Solar radiation that is reflected from various surfaces is already included in Kd (in the term MRTindirect ) along with diffuse solar radiation from surfaces and the sky.
Physiological equivalent temperature (PET-urban and PET-Rayman)
In this study, PET (Hoppe 1999) was quantified in two manners: (1) by directly applying the RayMan model (Matzarakis et al 2010) and (2) by using a statistical model of Koopmans et al (2020) that resulted in a 'PET-urban' variation to the indicator. The latter is based on an empirical regression model from the application of RayMan to urban areas. While some of the parameters might have been location-specific to where PET-urban was validated, the range of geolocations and weather variables input to the model can provide additional means to evaluate changes in PET.
Thus, PET-urban was applied in this study to take advantage of various observed quantities in the field and MRT is an implicit input in these calculations (on the other hand, MRT can be an explicit input to RayMan model). Calculated at 10-s intervals for every mobile transect performed in the project, PET-urban was computed per Koopmans et al (2020) as follows:


where Ta is air temperature, K total solar incoming and reflected radiation (from streets and canyon surfaces), U wind speed, Tw wet-bulb temperature (computed from psychrometrics), θ solar altitude angle, β Bowen ratio, ω sky-view factor, Kd diffuse solar radiation including reflected from surfaces (e.g., streets), σ Stefan–Boltzmann constant, and RH relative humidity.
Predicted mean vote (PMV)/predicted percentage dissatisfied (PPD)
In addition to calculating PET with the RayMan model, predicted mean vote (PMV) was also computed. Once PMV was calculated, PPD was quantified as:

Results
Reflectance
A brief comparison of radiative properties of DuraShield-SR against those of existing asphalt pavements in the study area is presented here. Table 1 lists the averages of measurements from several points in the field carried out with the Solar-I reflectometer presented above.
Table 1. DuraShield-SR reflectance profile compared to existing asphalt (these are averages; coating reflectances, especially in NIR, are much larger than listed here; e.g., figure 14).
| Range (μm) | Reflectance | |||
|---|---|---|---|---|
| Streets | Lots | |||
| asph. Pre-coating | post-coating (DuraShield-SR) | asph. Pre-coating | post-coating (DuraShield-SR) | |
| 0.335–0.380 | 0.035 | 0.043 | 0.059 | 0.045 |
| 0.400–0.540 | 0.047 | 0.109 | 0.090 | 0.120 |
| 0.480–0.600 | 0.050 | 0.094 | 0.098 | 0.102 |
| 0.590–0.720 | 0.053 | 0.103 | 0.107 | 0.112 |
| 0.700–1.100 | 0.059 | 0.263 | 0.118 | 0.308 |
| 1.000–1.700 | 0.066 | 0.321 | 0.127 | 0.376 |
| 1.700–2.500 | 0.073 | 0.289 | 0.134 | 0.329 |
Following application of reflective coatings, the UV albedo (reflectance) increased by a very small, negligible amount (+0.008) and in the case of parking lots, the UV albedo actually decreased (−0.014). These findings are desirable as discussed in the chemistry section below. Furthermore, the larger increases in albedo in DuraShield-SR occurred in the near-infrared (NIR) range, which is also desirable for glare avoidance (also discussed below). The averaged increase in NIR albedo relative to the existing asphalt pavement reached up to about 0.3. At specific locations, however, the increase in NIR albedo was much higher, up to 0.4 or more, as discussed later.
Pre-coating broad-band albedo
Broad-band albedo was computed from 7-bands reflectometer measurements in the field, using a spectral weighting function of 1.5 atmospheres. Figures 7 and 8 summarize some of the statistical attributes of albedo in the test and reference communities, respectively, showing that there was practically no difference, overall, in the albedo of streets between these two communities prior to coating. The medians for albedo were 0.0550 and 0.0535 and the means were 0.0544 and 0.0536, respectively. There were some small differences in the min/max ranges and the IQR. Skewness was different between the two communities which might have been one factor (in addition to being downwind) why the test community was slightly warmer than the reference community prior to coating.
Figure 7. Pre-coating albedo attributes in the test community streets.
Download figure:
Standard image High-resolution image
Figure 8. Pre-coating albedo attributes in the reference community streets.
Download figure:
Standard image High-resolution imageChanges in broad-band albedo
Whereas broad-band albedo calculations were carried out at 10-s intervals and measured continuously along all transects with a net radiometer on the cart (figure 2), reflectance was also measured (with the portable reflectometer) at several locations in the project area, shown with red circles in figure 9. Examples from these measurements are presented in figure 10 for pre- and post-coating conditions at random locations. While the post-coating broad-band albedo of streets (computed from reflectance) at these locations reached up to about 0.26 on average, likely because of rough surfaces or dirt particles, the post-coating albedo on smoother surfaces, such as in some parts of the streets, school playground, or parking lots (not shown) reached up to 0.33, similar to the nominal albedo of DuraShield-SR

Figure 9. Mobile-transect route and reflectometer sampling points. The two black circles are locations of the project's above-canopy weather stations, one in the test (top) and the other in the reference area (bottom).
Download figure:
Standard image High-resolution image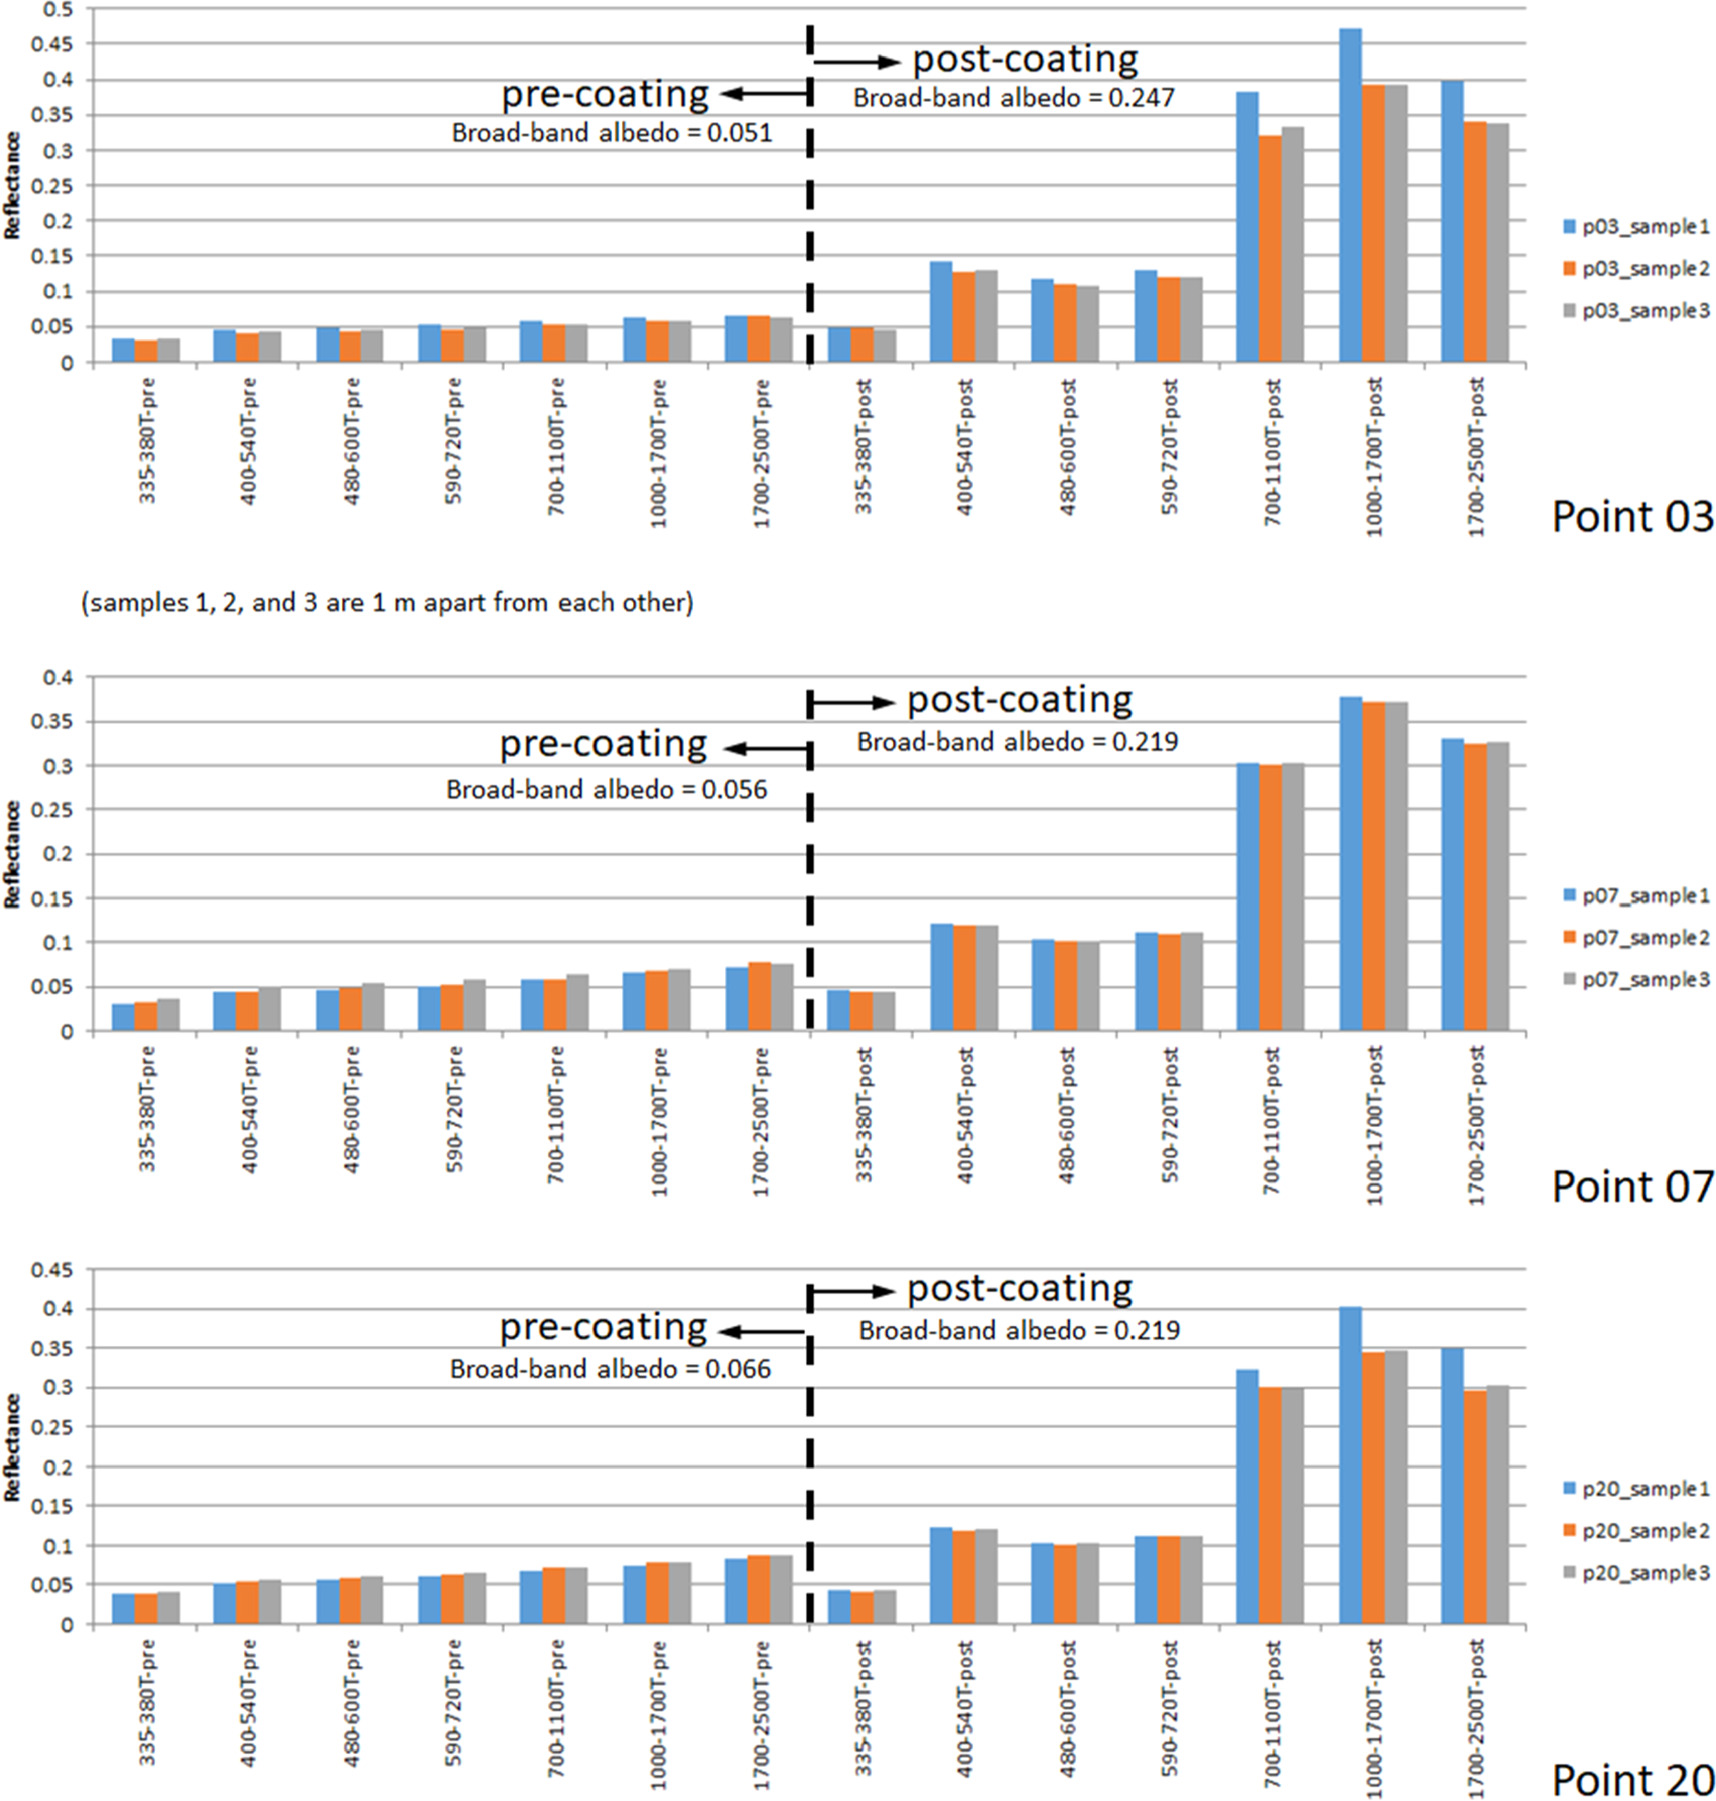
Figure 10. Reflectance readings and computed broad-band albedo at sample street locations.
Download figure:
Standard image High-resolution imageSince the changes in albedo impart multi-scale effects that are diagnosed at surface, near surface, street canyon, canopy layer, boundary layer, atmosphere, and top of atmosphere, it is of interest to get an idea as to these changes based on the surface modifications in Pacoima. Table 2 lists the increase in albedo as observed from different heights—the values listed here are to be understood as representative but not necessarily applicable to every situation encountered during the study. Changes can be larger than summarized here.
Table 2. Broad-band albedo increase as observed from different elevations above ground level over the test area in Pacoima.
| ALBEDO | school | parking lots | streets | ||
|---|---|---|---|---|---|
| at surface (measured with reflectometer) 0.5 cm resolution | baseline | 0.08–0.16 | 0.08–0.11 | 0.04–0.06 | |
| post-coating | change | +0.17 | +0.21 | +0.12–+0.20 | |
| new albedo | 0.25–0.33 | 0.27–0.32 | 0.16–0.26 | ||
| 60 cm above surface (measured with net radiometer) 4.5 m diameter field of view) | baseline | 0.06–0.16 | 0.12–0.15 | 0.05–0.12 | |
| post-coating | change | +0.11–+0.13 | +0.04–+0.13 | +0.05–+0.08 | |
| new albedo | 0.17–0.29 | 0.16–0.28 | 0.10–0.20 | ||
| Satellite | Sentinel-2 (10 m resolution) BOA change | +0.16 | +0.10 | +0.07 | |
| Landsat-9 (30 m resolution) TOA change | +0.10–+0.14 | +0.10–+0.12 | +0.06 | ||
| MODIS (500 m resolution) BOA change | +0.04 | ||||
As a radiometer's height above surface increases, the observed increase in albedo (from cool pavements) becomes smaller because areas of unchanged albedo, such as sidewalks, driveways, soil, vegetation, roofs, water, and grass, occupy an increasingly larger percentage of the radiometer's field of view. In addition, atmospheric effects (such as humidity or particulates loading) can come into play as well.
Figure 11 shows pre-coating albedo computed at 10-m resolution from Sentinel-2 satellite, indicating similar albedo in the streets of the project area (also see figures 7 and 8), except for the freeways that have higher albedo. Figure 12 compares the pre- and post-coating albedo computed at 30-m resolution from Landsat 9 satellite where it can be seen that the modified streets, school playground, parking lots, and basketball courts are more reflective as detected from top-of-atmosphere (TOA) following application of cool pavements.

Figure 11. 10-m Sentinel-2 pre-coating broad-band albedo.
Download figure:
Standard image High-resolution image
Figure 12. Top: Broad-band albedo (30 m) for May 14, 2022 (pre-coating example). Bottom: Broad-band albedo (30 m) for August 10, 2022 (post-coating example). Computed from Landsat-9 narrow bands.
Download figure:
Standard image High-resolution imageIn figure 12 (top), the school playground and the parking lots/courts have a lower albedo that's similar to most of their surrounds seen in this frame. The test and reference communities are similar in street albedo (no large differences are detected when comparing either sides of Borden Street). After installing the reflective pavements, it is noticed in figure 12 (bottom) that the playground now has a large area of higher albedo and so do the parking lots and basketball courts. The test community (east of Borden) also has a generally higher albedo (following coating) than the reference community and that can be seen clearly demarcated in the figure. Furthermore, streets like Daventry and Sylmar (north-west of the school playground) appear now more clearly with higher albedo values than in pre-coating conditions. In both figures, the darker shade is lower albedo and whiter is higher albedo and each contour level is a stepwise change of 0.04.
A final note related to changes in albedo: the project had a plan in place to track the degradation of reflectance (as measured with reflectometer) over time and also carry out power washing of streets to evaluate the restoration to higher values, but was scrapped because of the heavy rainfalls in California in winter 2022–2023. Continuous readings from net radiometer on mobile platform indicated little degradation in albedo.
Glare and visual environment
The field measurements demonstrated that another aspect of concern with cool pavements, potential glare, is a non-issue in this case. This assessment was based on comparing the spectral reflectance signatures of the reflective coating to those of the existing streets and parking-lot surfaces.
Figure 13 is a comparison between the reflectances in the visible spectrum (VIS) of the existing parking-lot material and the reflective coating that was applied, as measured in the field with the reflectometer. It can be seen that the VIS reflectance of existing parking-lot material (p1, p3, p4) was 0.08–0.10 (except for one instance). The reflectances of the coating were modestly higher in VIS, generally between 0.12 and 0.15, which is not large enough to cause visual/glare discomfort issues (also see figure 1, bottom).

Figure 13. Reflectance in the visible (VIS) range: comparison between existing parking-lot (p1, p3, p4) material and the DuraShield-SR reflective coating (p6, p5, p7). Wavelengths presented in this figure are 0.40–0.54 μm, 0.48–0.60 μm, and 0.59–0.72 μm. Each location is in triplicate as 3 samples were taken at nearby points.
Download figure:
Standard image High-resolution imageHowever, upon examination of changes in the NIR ranges, as seen in figure 14, it is clear that there was a much larger increase in reflectance of the coating relative to existing material. In other words, the increase in albedo from installing DuraShield-SR resulted mostly from increased reflectance in the NIR, not in the VIS range. As such, the visual/glare environment is not affected negatively but the benefits in terms of cooling are significant. In this case, the NIR reflectance of existing parking-lot material was about 0.1 to 0.15 whereas the NIR reflectance of the reflective coating was between 0.4 and 0.5, a very significant increase.
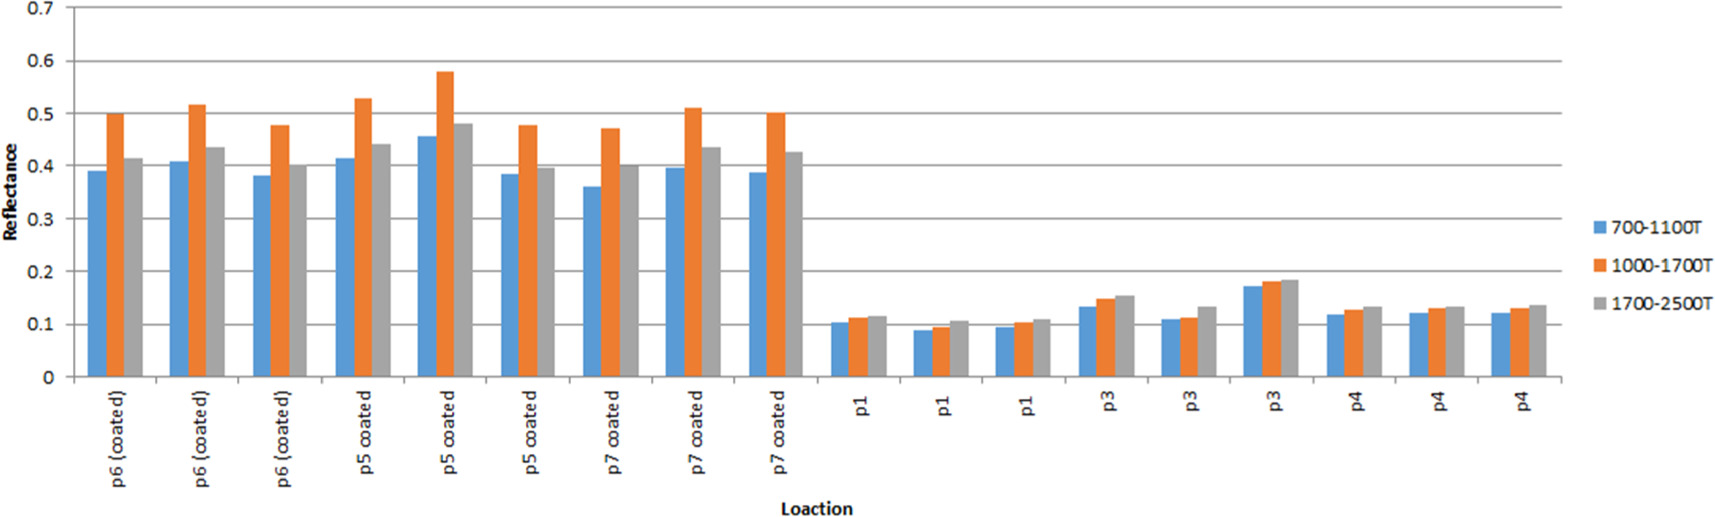
Figure 14. Reflectance in the near-infrared (NIR) ranges: comparison between existing parking-lot material (p1, p3, p4) and the DuraShield-SR coating (p6, p5, p7). Wavelengths presented in this figure are 0.70–1.10 μm, 1.00–1.70 μm, and 1.70–2.50 μm. Each location is in triplicate as 3 samples were taken at nearby points.
Download figure:
Standard image High-resolution imageImpacts on photochemistry
For cool-community measures that include reflective materials, such as cool pavements, the albedo of interest is usually in the range of 0.28 to 2.8 μm, i.e., solar albedo. This includes tropospheric radiation in the UV, VIS, and NIR spectra. In addition to the main effect of changing VIS and NIR albedo, there is interest in the potential effects of possible changes in UV albedo as a result of implementing cool pavements (Taha 2008b) and some studies, e.g., Epstein et al (2017) have raised potential air-quality concerns in this regard. This is so because the energies in the UV wavelength range drive most of the important photodissociation reactions, e.g., those of NO2, O3, and PAN, that can have potential implications on ozone formation, i.e., possible negative impacts. However, in reality, the proposed changes in urban surface albedo may have small or no effect at all on UV and, in some cases, the UV albedo actually decreases, as discussed above in relation to measurements with the reflectometer.
In the UV spectrum (UV-A: 0.315–0.400 μm, UV-B: 0.280–0.315 μm, and UV-C: 0.100–0.280 μm), stratospheric oxygen absorbs radiation in the range 0.17–0.24 μm and photodissociates to produce ozone via: O2 + hν → 2 O (3P) and O (3P) + O2 + M → O3 + M
where M = air = N2, O2. This leaves mainly UV-B and UV-A radiation to reach the troposphere because the stratospheric ozone produced in the above process absorbs UV at and below 0.29 μm. Thus in the troposphere, wavelengths of relevance to photochemical reactions are those longer than 0.30 μm (Seinfeld and Pandis 1998).
NO2 absorbs at wavelengths of 0.45 μm or shorter, but because there is little UV radiation reaching the troposphere at or shorter than 0.29 μm, the theoretical critical UV range of interest for NO2 is thus between 0.30 and 0.45 μm (Cooper and Alley 1994). Further narrowing this range is the fact that 90% of the NO2 molecules absorb UV energy below 0.4 μm (Stern et al 1984) and as a result, the practical range of importance for NO2 photodissociation is 0.3 to 0.37 μm (Seinfeld 1975), thus mostly within the UV-A range. For O3, the critical UV wavelength range is 0.315 μm or shorter (Harrison 1990) and for PAN, the cutoff is 0.35 μm or shorter (Seinfeld and Pandis 1998). Thus the inclusive range of 0.3 to 0.37 μm is the overall 'envelope' that needs to be considered when modifying surface albedo. This range corresponds to the first reflectance band of the reflectometer shown in table 1.
Since UV albedo in this range does not change significantly (or even decreases) with the application of DuraShield-SR coatings (table 1), the UV albedo-chemistry issue is not a concern in this case. As Berdahl et al (2002) and Taha (2005) showed, there are other coatings and materials that increase VIS and NIR albedo significantly without affecting UV albedo.
Impacts on air and surface temperatures in the urban canopy layer
A range of effects on air temperature was observed when directly comparing the test and reference segments of streets (RT) -- predominantly lower but also slightly higher at times (due to transport and mixing). Surface temperature, on the other hand, was always lower. However, the effective temperature change, i.e., taking into account pre-coating conditions (DofD), was always a reduction in both air and surface temperatures.
While this section presents averages over street segments for typical summer conditions, some of the observed maximum air-temperature reductions occurred during a heat wave event (table 3). These were RT differences, not DofD, since there was no pre-coating heat-wave event to compare to. The maximum differences during that event reached up to −1.9 °C.
Table 3. Maximum RT temperature differences during the heat-wave event of September 3–7, 2022. In-canopy air temperatures were measured at 1.3 m AGL in shade. Above-canopy variables were obtained from the project's two weather stations (at 8 m AGL).
| Date (2022) | Segment time interval (PDT) | Above-canopy wind direction (°) | Above-canopy wind speed (m s−1) | Above-canopy air temperature (°C) | In-canopy air temperature (°C) | Max. in-canopy temperature difference (°C) | Max. in-canopy temperature difference (°C) |
|---|---|---|---|---|---|---|---|
| Sep 5 | 1315–1330 | 190 | 1.7 | 39.4 | Montford: 43.3 Weidner: 41.1 | Montford −0.8 | Weidner −1.9 |
| Sep 4 | 1500–1530 | 187 | 3.3 | 41.3 | Montford: 45.0 Weidner: 44.4 | Montford −1.3 | Weidner −1.9 |
| Sep 4 | 1600–1630 | 30 | 2.2 | 40.2 | Mercer: 44.5 Judd: 43.8 | Mercer −1.9 | Judd −1.7 |
| Sep 5 | 1230–1300 | 200 | 1.4 | 38.0 | Filmore: 40.6 Louvre: 41.7 | Filmore −1.4 | Louvre −0.7 |
Several mobile transects were also carried out during winter months (November/December 2022), to characterize the effects of cool pavements in overcast, wintertime conditions. It was found that the differences were small or negligible in surface and air temperatures between the test and reference communities. This is a desirable outcome as it suggests that the effects of street albedo increase are minimal or non-existent during wintertime which can help avert any potential negative effects on heating-energy needs.
Figure 15(a)–(e) is a random transect, in this case showing a loop from 1040 to 1120 PDT on 10/07/2022 as an example from more typical summer conditions. Figure 15(a) depicts air temperature measured at three levels (0.6 m, 1.3 m, and 2 m AGL) starting at Montford Street in the northeast and ending at Mercer Street in the southern part of the study area (see figures 2 and 9). The general tendency in air temperature, in this case, was a small increase from north to south by ∼1 °C while relative humidity decreased by a small amount, from 56% to 52% (figure 15(b)). On a street-by street basis, however, the temperature tendency was smaller than 0.05 °C and thus no detrending was necessary on this basis. Furthermore, the alternate looping from E→W to W→E was designed to cancel out such tendencies even if small.

Figure 15. Sample of observed variables during a transect on 10/7/2022 for a loop from 1040 to 1120 PDT. (a). Air temperature (°C) at 0.6, 1.3, and 2.0 m AGL. (b): Relative humidity (%) at 1.3 m AGL. (c): Side-view solar radiation (W m−2). (d): Incoming/reflected solar radiation and downwelling/upwelling long-wave radiation at street level (W m−2). (e): Roadway surface temperature (°C).
Download figure:
Standard image High-resolution imageFigure 15(c) depicts the variations in side-view incoming solar radiation as the sensor alternated between facing the northern and southern hemispheres during each loop. This information helped identify direct and diffuse radiation for the calculation of thermal indicators such as MRT (equations (5)–(7)). For example, in this particular transect, solar radiation below 200 W m−2 was deemed diffuse (when sensor was facing north) and above that was direct+diffuse (sensor facing south). Furthermore, this type of time series also helped identify outliers, e.g., shaded street spots (such as at the right end of the series) that were then removed from the analysis when developing correlations. In this study, outliers were identified as the more stringent of either V > (Q3 + 1.5 IQR) or V < (Q1–1.5 IQR); or  where Z is the Z-score and IQR is the interquartile range for a variable V. In some subsequent figures, these are labeled 'IQR 1.5' or 'Z3'.
In figure 15(d), the incoming (down) and reflected (up) solar radiation is shown along with downwelled and upwelled longwave radiation (from an Apogee net radiometer on the golf cart) and figure 15(e) is the corresponding surface temperature. The horizontal gaps in the time series in these figures correspond to transitioning from E to W or W to E segments of each street across the divider (Borden Street) between the test and reference areas.
These readings, e.g., for air and surface temperatures, were then averaged over each E and W segment of each street and transect. Table 4 is a random example from the reporting of such averaging results. Lastly, table 5 lists the net radiation and differences at the E and W segments of each street corresponding to the time series of figure 15.
Table 4. Street-segment averaging calculations, example for 06/27/2023, loop No. 5 (1742–1809 PDT).
| Δ Tair_1 (°C) RT | Δ Tair_2 (°C) RT | Δ Tsfc (°C) RT | Δ Tair_1 (°C) DofD | Δ Tair_2 (°C) DofD | Δ Tsfc (°C) DofD | |
|---|---|---|---|---|---|---|
| Montford E minus W | −0.23 | −0.53 | −1.02 | −0.62 | −0.93 | −3.34 |
| Weidner E minus W | −0.49 | −1.05 | −5.64 | −1.39 | −1.96 | −8.41 |
| Louvre E minus W | −0.22 | −0.04 | −4.19 | −1.17 | −0.99 | −6.38 |
| Filmore E minus W | −0.34 | −0.24 | −1.55 | −0.73 | −0.63 | −3.08 |
| Judd E minus W | −0.40 | −0.44 | −4.38 | −1.47 | −1.51 | −7.07 |
| Mercer E minus W | −0.14 | −0.17 | −4.44 | −1.43 | −1.46 | −6.39 |
Table 5. Net radiative fluxes (Q*) and differences: example for 1040–1120 PDT, 10/07/2022.
| Street | Q* (W m−2) = K↓ - K↑ + L↓ - L↑ | ||
|---|---|---|---|
| E (coated) | W (uncoated) | RT difference (E-W) | |
| Montford | 382 | 412 | −31 |
| Weidner | 372 | 442 | −70 |
| Louvre | 400 | 432 | −32 |
| Filmore | 433 | 451 | −18 |
| Judd | 417 | 453 | −36 |
| Mercer | 406 | 443 | −37 |
Figure 16 is an overall summary of temperature differences (°C) at street segments (based on a large number of tabulations similar to the example in table 4). These exclude the winter month of December 2022 and heat wave period, as discussed earlier. Table A-3 in the Supplement provides descriptive statistics with respect to this figure. As noted, these are based on street-segment averages, not 10-s data readings that could show much larger but also highly variable effects. This is done to facilitate interpretation of results at street or community scales rather than at particular spot-measurement locations.

Figure 16. Differences (RT) and changes (DofD) in surface and air temperatures as observed during mobile transects. All statistics are in °C and are based on street-segment averages.
Download figure:
Standard image High-resolution imageThe observed meteorological conditions, including air temperature, wind speed, wind direction, and solar radiation, corresponding to the differences and changes in air and surface temperatures reported in figure 16 are provided in figure A-1 of the Supplement.
A clear pattern is seen in figure 16 -- that there was a larger decrease in temperatures during daytime and smaller, but still significant, reductions at night. From midnight to pre-sunrise and immediately after sunrise, mean of air-temperature differences ranged from −0.12 to −0.14 °C RT and for surface temperature from −0.72 to −0.79 °C RT. From morning to evening, the mean of differences in air temperature ranged from −0.13 to −0.26 °C RT and −0.60 to −1.21 °C DofD. For surface temperature, the mean of differences ranged from −2.5 to −2.97 °C RT and −4.7 to −5.73 °C DofD. Figure 16 also shows quartiles and maxima indicating that there were large reductions in temperature both RT and DofD, especially in the afternoon (note that the small dots are outliers). There were also increases but generally smaller.
In table 6, examples of the maximum temperature reductions (similar to table 3 above but for non-heat-wave conditions) are provided based on street-segment averages. Note that, statistically, a small number of these could be considered as outliers in some cases (as shown in figure 16). However, these were actual and valid measurements in the field, not errors. Furthermore, a test was carried out to evaluate the statistical significance of changes in surface and air temperatures as a function albedo. The p-values obtained were consistently under 0.0001 indicating high significance of the reported cooling results.
Table 6. Non-heat-wave, hot-day maximum cooling achieved during this study.
| Change in air temperature | Change in surface temperature | |
|---|---|---|
| 1400 PDT | −1.4 °C RT | −9.2 °C RT |
| −2.8 °C DofD | −12.2 °C DofD | |
| 1600 PDT | −0.6 °C RT | −7.5 °C RT |
| −1.8 °C DofD | −10.3 °C DofD | |
| 1800 PDT | −1.4 °C RT | −6.1 °C RT |
| −2.3 °C DofD | −8.8 °C DofD | |
| mid-night | −0.7 °C RT | −1.6 °C RT |
Some other attributes of changes in the air-temperature field that were observed included the local rates of heating or cooling in the test and reference areas during cloud-free days of the monitored periods. The observed air-temperature tendencies on average were:
- Pre solar noon: the test community warmed up by 0.07 °C–0.20 °C h−1 slower than the reference community (i.e., delayed warming)
- Around solar noon: the test community warmed up by between 0.15 °C h−1 faster and 0.31 °C h−1 slower than reference community (that is, a mixed signal but mainly a delayed warming effect)
- Post solar noon: the test community cooled down by 0.50 °C h−1 faster than the reference community (enhanced cooling effect).
It is also of interest to view the cooling achieved by reflective pavements in the context of typical magnitudes of urban heat or location-specific heat islands. Taha (2017) developed the Urban Heat Island Index (UHII) for the State of California and showed that in Pacoima (figure 17), the summer UHII is between 22 and 27 °C·h day−1 (no thresholds). This is equivalent to an average urban heat island (°C·h h−1) of between 0.90 and 1.13 °C (all day/night hours inclusive) and depending on wind direction. Thus, the cooling achieved by the reflective pavement (figure 16) is significant and can offset 25%-50% of the local UHII, depending on time of day.

Figure 17. CalEPA UHI Index (UHII) for census tracts in San Fernando Valley (Taha 2017). At the center of the white oval is the Pacoima project area.
Download figure:
Standard image High-resolution imageImpacts on street-level thermal comfort
Metrics that were used to evaluate the effects of cool pavements on thermal comfort at street level included MRT, PET-urban, PET-RayMan, PMV, and PPD as introduced above. With respect to MRT, field measurements in this study indicated that relative to existing/typical asphalt, areas with DuraShield-SR had increased reflected solar radiation but also significant decreases in longwave upwelling, which contributed to lowering radiant temperatures. The real-time (RT) observations in Pacoima indicated both increases and decreases in MRT but that the median difference was −0.91 °C and the mean −0.97 °C, community-wide, calculated across a range of weather conditions, times of day, and sun angles.
Figures 18 and 19 depict results from calculations of PET, PMV, and PPD and table A-4 (in Supplement) is a summary of related statistics. As seen in figure 18, the mean of the differences in PET-urban (differences between test and reference communities), where MRT is implicitly accounted for, reached up to −0.36 °C. With the RayMan model, MRT was specified explicitly as one of the input parameters (based on mobile-transect observations) and so had a larger impact on the calculations of PET. The mean of differences in PET-Rayman reached up to −0.66 °C, as indicated by 'MRT explicit' in the figure. Of note, the reductions in PET, percentagewise, were slightly smaller (implying less cooling effects) when in direct sun versus indirect. These changes pertained to real-time (RT), side-by-side differences between the test and reference communities (indicated by 'Real time' in figure 18). When DofD was applied (along with the explicit MRT input), the mean of changes in PET-RayMan reached up to −1.77 °C as shown at the right end of the figure.

Figure 18. Differences in PET (°C) based on mobile-transect observations in Pacoima.
Download figure:
Standard image High-resolution image
Figure 19. Differences in PMV and PPD from RayMan-model calculations based on mobile-transect observations in Pacoima.
Download figure:
Standard image High-resolution image
Calculations with the RayMan model showed that reflective coatings reduced PMV by an average of 0.09 RT and an average of 0.32 DofD (figure 19). Since PMV ranges from −3 to +3, these average reductions correspond to 2% and 5%, respectively. Finally, the mean of changes in predicted percent dissatisfied (PPD) was −2.86 percentage points RT and −7.87 percentage points DofD (the range of PPD is from 5% to 100%).
As seen in figures 18 and 19, there are both increases and decreases in the indicators but that the dominant effect is a reduction (benefit). This suggests, overall, no net penalties from cool pavements in terms of thermal comfort at pedestrian level.
Discussion
Results from this year-long, detailed, multi-platform observational study of reflective pavements in Pacoima, California, indicated a wide range of and variability in effects. The dominant impacts, however, were significantly beneficial including reductions in urban canopy-layer surface and air temperatures below 2 m AGL. The results also showed no anticipated negative impacts on the visual environment (no glare), on photochemistry (potential effects of UV albedo changes on air quality), or on the thermal environment.
Micrometeorological conditions and changes were discussed at length in this paper. Here, in this section, three aspects of interest are discussed further—these are changes in air temperature, surface temperature, and thermal-environmental indicators. And while there is a number of theoretical and numerical modeling studies of the effects of cool pavements as mentioned in this paper, including by this author, the discussion in this section compares results only to other real-world observational studies of reflective pavements that have, so far, been limited.
The maximum observed side-by-side (RT) differences in air temperature during this entire study were −1.9 °C RT during a heat wave and a maximum of −1.4 °C RT in other hot days.
During more typical summer conditions, this study observed a mean air temperature difference of −0.2 °C RT and a maximum of −1.2 °C RT (excluding outliers and single instances of larger reductions). With difference-of-difference (DofD), the mean and maximum were −1.2 and −2.8 °C, respectively. Thus in terms of RT, these results are larger than but crudely comparable with Schneider et al (average of −0.3 °C RT and maximum of −0.6 °C RT) and larger than the maximum of −0.5 °C RT reported by Middel et al (2020). However, they are comparable to Kyriakodis and Santamouris (2017) of −1.5 °C RT. Unfortunately, these studies did not include DofD results to compare with. This project also observed a diurnal pattern of larger cooling during the daytime and smaller, but still significant cooling at night, in agreement with findings from Ko et al (2022).
In terms of surface temperature, the maximum observed difference in this study was −9.2 °C RT and −12.2 °C DofD. This is larger than surface-temperature changes reported in some other studies, e.g., a maximum of around −5.0 °C DofD (Ko et al 2022) and −4 to −6 °C RT by Middel et al (2020). However, they are comparable with results from Schneider et al (2023) reporting a maximum of −8.4 RT and Kyriakodis and Santamouris (2017) of −11.5 °C RT for roughly similar increases in albedo. During more typical summer days, the mean of surface-temperature differences was −2.6 °C RT and −4.9 °C DofD. Again, the lack of DofD in other studies limited further comparisons of these local changes.
With respect to MRT, Middel et al (2020) reported changes of −1.0 to +4.2 °C (RT) and Schneider et al (2023) reported changes of −1.3 to +5.1 °C (RT) during different times of the day from a limited number of transect days and at pre-determined locations. The potential offsetting effects of wind speed, i.e., convective versus radiative heat transfers at the human body were not discussed. This study, with a slightly-modified calculation methodology and computations at 5–10-s intervals from 73 transects, reported maximum increases in MRT of 0.8 °C–1.2 °C but also significant reductions such that the mean of differences was between −0.9 and −1.3 °C RT community-wide. This study also evaluated the changes in other metrics, PET, PMV and PPD, reporting mean PET differences of between −0.2 °C and −0.6 °C RT and −1.7 °C DofD, and mean PMV differences of −0.09 RT and −0.32 DofD. To this author's best knowledge, no other observational studies of cool pavements have reported these additional metrics, thus no direct comparisons were feasible.
While it is not possible to assign a single cause to each of the differences listed above, or to pinpoint one single factor(s) that contributed to the relatively larger beneficial effects reported in this study, they can be attributed mainly to the properties of the coatings, the environment, and the improved observations used in quantifying these effects. Thus, several factors, in combination, should be borne in mind when comparing results.
First, the reflective coatings; in addition to the cooling benefits of lowered surface and air temperatures from increased albedo, other effects that were attributable to radiative properties of DuraShield-SR reflective coatings used in Pacoima included the larger increase in NIR albedo relative to the increase in VIS albedo and the significant reductions in upwelling longwave compared to increase in reflected shortwave radiation. This contributed to lowering radiant temperatures generally. Other potential benefits, especially in terms of chemistry, relate to the unchanged UV albedo following coating of streets and other surfaces.
Second, factors related to site and study design included that the surfaces coated with reflective products were large (59,570 m2) and concatenated within a relatively compact area, meaning that they could exert more pronounced effects on temperature (among other variables) than if spread out further. The streets in Pacoima are oriented 41.5° (SW—NE) and the flow in this area is southerly-to-southwesterly about 80% of the time. As such, an air parcel has a longer contact with a coated street than if the wind were blowing from other directions (each coated street segment was between 500 and 650 m in length along the wind path). This could be an additional factor in producing larger observed cooling and, in general, the transect data show the lowest temperatures to be near the downwind (northeastern) ends of streets (and at opposite ends when the wind is northeasterly, although much less frequent). High-resolution (50-m) atmospheric/micrometeorological modeling with a modified WRF-ARW model (not presented here) also showed advection of cooler air downwind in that direction beyond the modified areas of the test community.
Furthermore, the project area lies in a lower-traffic neighborhood and, as such, the signal from cool pavements may not be as diluted as if the area were subject to through traffic (effects of tailpipe heat and enhanced air mixing from moving vehicles). Although the study did not find any such indications, it is hypothetically possible that some area-specific characteristics, in Pacoima, could have enhanced the role of reflective pavements in cooling the area.
The mobile-observation routes in this project were designed to thread through both test and reference segments of each street continuously in-line and immediately alternating between test and reference areas. This is more accurate than if an entire test area was covered first and then the monitoring moved on to a reference area, thus incurring considerable elapsed time in-between and providing no direct street-to-street comparison of the observations. In this study, the two areas were also selected to be adjacent and there were no physical separations between them. All this meant that there was no significant elapsed time when threading through each street's E and W segments thus ensuring no atmospheric or environmental changes occurred during transitions between the segments. As a result, no detrending of observations was necessary and direct, real-time comparisons between modified and unmodified segments of each street were feasible.
A related factor is that the test and reference segments of each street in this study were a continuation of each other, with similar geometries and same exact orientation, coated with the same product throughout, thus allowing a direct comparison by canceling out potential effects of geometry, shading, view factors, solar angle, vehicular traffic, product variations, or other effects. This can help capture the community-wide signal of cool pavements better than in situations where the test and reference areas have different street orientations and configurations. In addition, the project's two weather stations were used to monitor above-canopy micrometeorology and ensure that the environmental changes observed at street level were not a result of some changes in background conditions.
Furthermore, a large number of data points were collected in this project via multi-platform, multi-sensor observations. To this author's best knowledge, the number of transect-days in this study was greater than reported elsewhere. With the mobile sensors, data were collected from 73 full transects (each about 6.76 km long) while logging variables continuously at 5–10-s intervals in addition to remote-sensing and in situ spot measurements. The mobile observations were designed to gather information continuously through the test and references areas to capture and characterize the effects of cool pavements community-wide rather than at separate predetermined locations that can be more influenced by point-specific changes in heat fluxes.
The study used research/science-grade fast-response sensors and instruments with high accuracy. This allowed for a rapid capture of the cool-pavements effects and correlation with varying environmental properties along the transects as well as in the calculations of derivatives, such as albedo, MRT, and PET. Further, this study recorded air-temperature observations at 2.0, 1.3., and 0.6 m AGL on the mobile platform, possibly closer to the ground than reported in other studies, potentially explaining some of the larger observed cooling effects. The project also used multiple heat- and thermal-comfort metrics to get a more comprehensive look at the potential impacts from cool pavements. Several of these metrics also maximized the use of observed variables available from the mobile field measurements throughout the project area.
Finally, as the study also included a baseline characterization of thermal-environmental conditions, it was possible to compare test and reference segments of each street at each time of day in a real-time side-by-side manner as well as in a difference-of-difference approach to assess changes in air temperature, surface temperature, and other metrics. The DofD approach allowed for better characterizing the local changes resulting from cool pavements. Other studies, e.g., Ko et al (2022) also used a DofD approach but did not get significant results for air temperature (only surface temperature) because of high micrometeorological variability. In this study, the large number of observations allowed for application of DofD to air temperature (and other variables) within specified ranges of micrometeorological conditions.
Conclusion
This observational study demonstrated that cool pavements can impart significant effects on the thermal environment in urban areas. This was characterized via detailed monitoring plans and observational methodologies to capture the variability in and ranges of impacts on surface conditions and near-surface micrometeorology. The study also showed that the spectral radiative signature of the reflective coatings used in this project, i.e., increases in near-infrared albedo vs. visible albedo and longwave versus shortwave radiative flux changes, were important contributors to the observed benefits.
The analysis indicated that there was variability in the impacts of cool pavements, as expected, but that the dominant effects were beneficial both in direct side-by-side, real-time comparisons between test and reference areas, as well as in difference-of-difference comparisons that quantified the local changes in the test area.
Some of the larger reductions in temperature were observed during a heat-wave event. Through typical and hot-weather summer conditions, the effects of cool pavements were similarly beneficial. Street-segment averages indicated significant cooling during the daytime, especially in the afternoon, and smaller but still significant cooling at night.
While it could be that some of these results were influenced by location or site aspects specific to Pacoima, the general findings suggest that beneficial effects from cool pavements can be replicated elsewhere. This will be a continuing endeavor, however, to gain further insight on cool-pavement effects at other locations and in different conditions. This study and its findings invite additional research in this area and it is hoped that the results would eventually assist in efforts aimed at quantifying the radiative-forcing equivalents of cool pavements and cool surfaces in general.
Acknowledgments
This study was funded by GAF who also installed reflective coatings in a community in Pacoima, California. The GAF team is acknowledged for supporting this effort, providing the cool-pavement coatings, and acquiring sensors, instruments, EV cart, and weather stations as needed in the project. Climate Resolve and Pacoima Beautiful are acknowledged for extensive work, support, and assistance on the ground and in carrying out extensive mobile field measurements with the golf cart during difficult times of days and conditions. Creative Paving Solutions is acknowledged for installing the reflective coatings on streets, parking lots, and school grounds. StreetsLA and Urban Semillas are acknowledged for permissions and support in implementing the project.
The author received support from GAF to design the monitoring plan, weather stations, and mobile platform and to carry out independent research. GAF had no role in the design of the study, data collection, monitoring, modeling, or analysis/interpretation of data and results.
The opinions expressed in this article are solely the author's. They do not necessarily reflect the views of GAF, its employees, subcontractors, or affiliates.
Data availability statement
All data that support the findings of this study are included within the article (and any supplementary files).
Product
Coating various surfaces was carried out using GAF StreetBond/DuraShield with Invisible ShadeTM and 120/150 products with solar reflective properties. For short, this product was referred to as DuraShield-SR in this article.
Data and material samples
Data of micrometeorological effects and thermal-environmental metrics are available in the Supplement. Additional information or data can be made available upon reasonable request to author, subject to approval by GAF. Samples of reflective coatings can be made available from GAF upon request.
Citations for satellite/remote sensing data
MODIS: ORNL DAAC, Oak Ridge, Tennessee. DOI: 10.3334/ORNLDAAC/1336.
Landsat 9 and ECOSTRESS data: Courtesy US Geological Survey and NASA / JPL.
Sentinel 2 data: Modified Copernicus Sentinel data 2023 / Sentinel Hub.
Supplementary data (2.3 MB PDF)